

The State of Stable Swaps
Content
Abstract
Stable-to-stable swaps are a vital yet underexplored primitive essential to maintaining the stability of the broader stablecoin ecosystem. In this paper, we examine the current state of stable swaps, their structural evolution, efficiency, and prevailing trends, while also identifying key design shortcomings. We evaluate slippage encountered by traders and focus on the impact of toxic order flow in a context where its presence expected to be minimal. We further evaluate the performance of a simple CSAMM model and introduce a PMM-like model that enables zero-slippage swaps. The findings of this study underscore the significance of appropriate fee structures and illustrate that, in conjunction with slippage-free execution, stable swaps can attain substantially enhanced efficiency and fair execution, thereby promoting the broader stablecoins adoption.
1. Introduction
Stable swaps refer to swaps between tokens that are intended to maintain equivalent value – typically stablecoins such as USDC, USDT, and DAI, all of which are pegged to the U.S. dollar. Stable swaps are one of the most crucial primitives, both ensuring a fair exchange for users and effectively involving stablecoins in the entire DeFi infrastructure. However, stable swaps have remained in the shadows despite their foundational value to the entire stablecoin infrastructure, which has been garnering increasing attention from all industry participants in recent years.
According to Artemis, the total stablecoin supply has increased considerably over 2024, rising from $129.8b to $203.4b, with more than half of it residing on Ethereum. Although stable swaps account for over 30% of total trading volume, they represent less than 5% of all trades – suggesting that the average stable swap is nearly 10 times larger than a typical transaction (Figure 1).
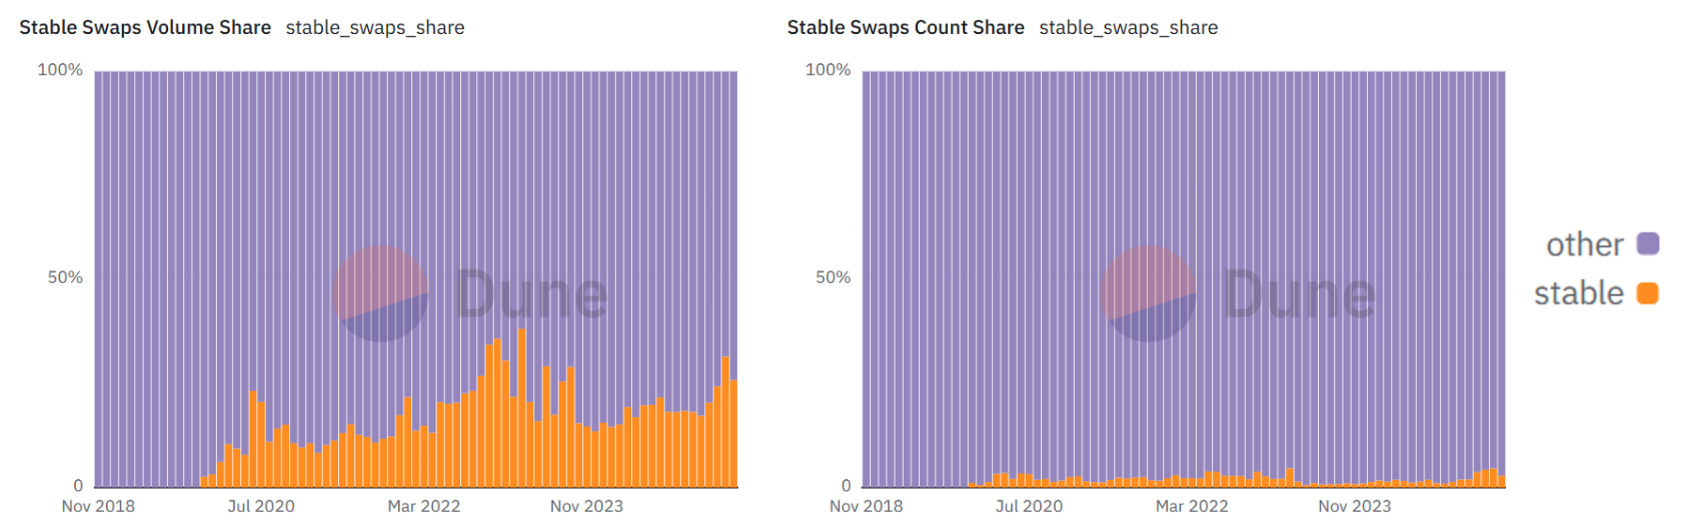 Figure 1. Stable swaps share of total DEX trades metrics.
In this paper, we examine stable swaps on the Ethereum mainnet, which remains the largest cryptoeconomic security layer, attracting a growing range of stablecoin issuers, including established players from traditional finance. While our focus is on Ethereum, maintaining exchange rates near a 1:1 parity is essential across all ecosystems to preserve economic utility, minimize slippage in high- volume transactions, and support the composability of DeFi protocols. As more and more stablecoins emerge, we anticipate that the provision swaps at a sustainable exchange rate will become vital to the further growth of stablecoin adoption.
2. Evolution of stable swaps.
Since a stable swap involves two assets that have the same benchmark price, it should always be executed at a rate as close to 1:1 parity as possible. Therefore, it is obvious that the constant product AMM (CPAMM) is not suitable for stable swaps, as the exchange rate in it is highly dependent on the token ratio in the pool. At the same time, a constant‐sum AMM (CSAMM) would theoretically deliver zero slippage at parity, but the design proved brittle in the thin‐liquidity environment of 2019-2020, when even modest trades could drain reserves and expose liquidity providers to arbitrage bleed.
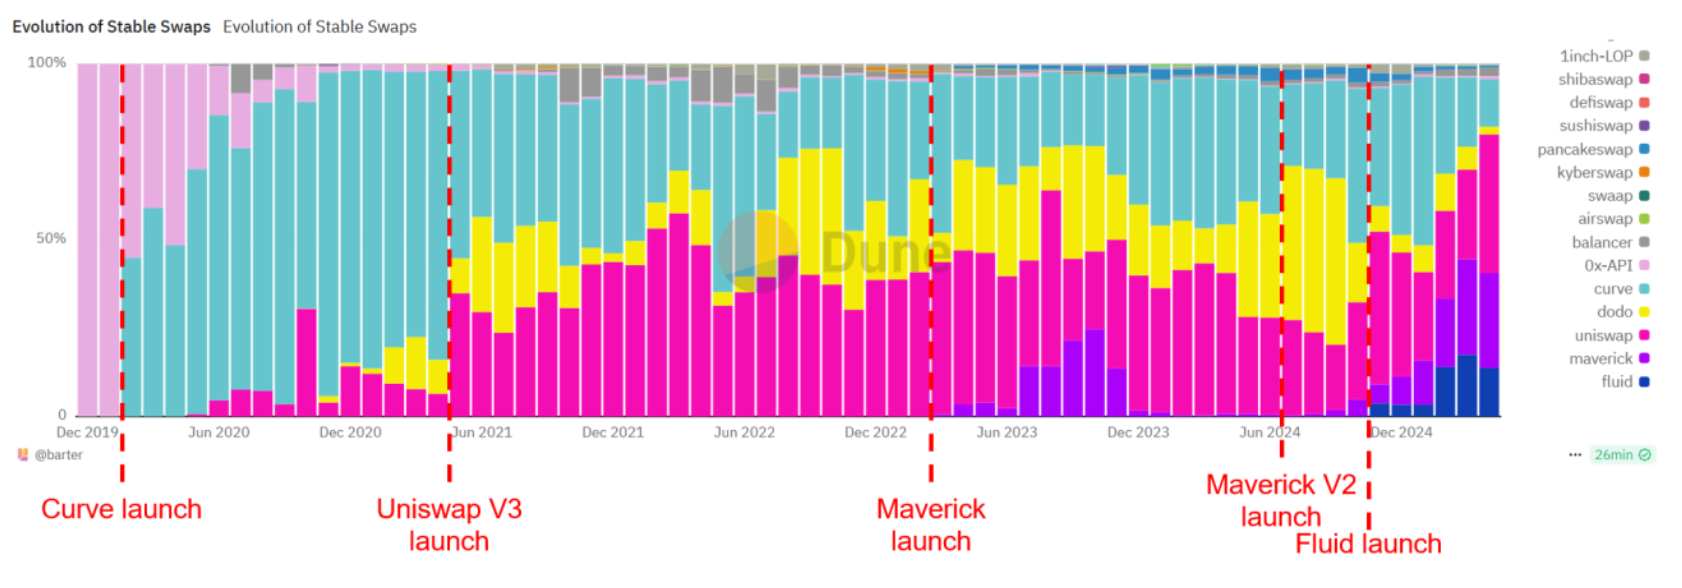 Figure 2. Evolution of a stable swaps landscape with key milestones.
The first solution of the problem was invented by the Curve team in 2019, Stable Math approximates the constant product curve to constant sum at the center section of the price curve. The next major milestone in the evolution of stable swaps was the launch of Uniswap V3 in May 2021, which allowed to concentrate liquidity in a narrow price range, ideal for stable swaps. Concentrated pools have subsequently become the basis for many highly efficient protocols such as Maverick or Fluid, accountable for 36.1% of all stable swaps volume for May 2025. (Figure 2)
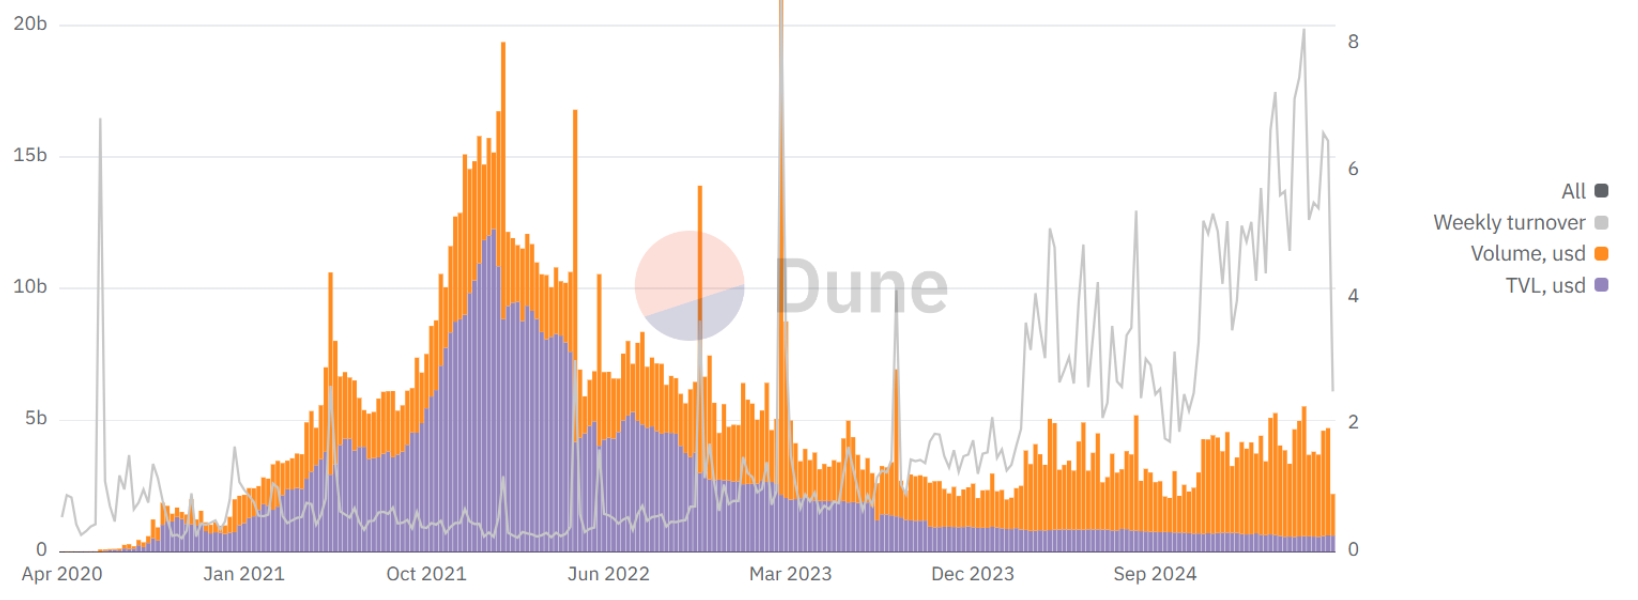 Figure 3. TVL of all stable pools (purple), stable swaps volume (orange) and weekly funds velocity (gray).
Equally, significant changes have occurred in the structure of stable pools' liquidity. At its peak in January 2022 stable pools' TVL was over $12b, while weekly stable swap volume was $2.9b, resulting in a weekly pool fund turnover rate of 24%. Since that time the total stable pools' TVL has plummeted by a factor of about 20 and as of March 2025 equals roughly $600m and is continuing to decline. However, over the past six months, weekly stable swaps volume is $1.4b - $4.9b, which is reflected as a weekly pool turnover rate of 189% - 824%. The data shows a significant increase in capital efficiency while maintaining sufficient liquidity depth, as well as the presence of a limit in demand for liquidity. (Figure 3)
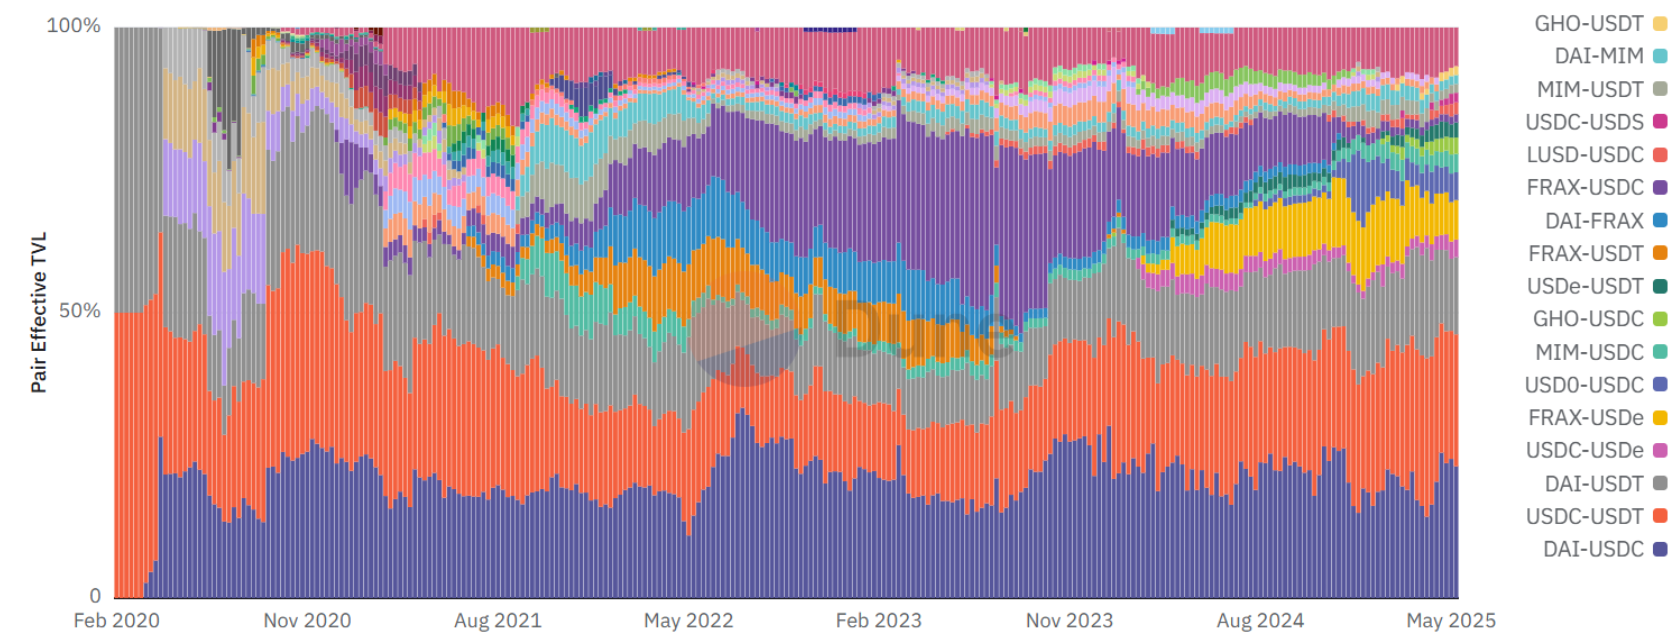 Figure 4. Stable pairs’ weekly effective TVL breakdown by trading pair.
Regarding the distribution of liquidity among the stable pairs, expectedly the majority of liquidity is concentrated in the three main pairs - USDC-USDT, DAI-USDC and DAI-USDT. (Figure 4) As of May 2025, these three pairs account for 55% to 60% of all effective stable pairs’ liquidity1. However, the present liquidity allocation cannot be called optimal. The data below, shows that pairs with relatively new stablecoins such as USDe, USD0, GHO have significantly higher liquidity turnover values than older pairs such as DAI-USDC, DAI-USDT. (Table 1) For instance, USDe-FRAX has only $25.1m TVL, while having a monthly turnover of 4280%. The reason behind this is the fact that most of the liquidity in old pairs is sitting in legacy pools such as 3pool, even without a satisfying APY, making it very difficult for new stablecoins to access the existing liquidity, thus creating the necessity to constantly incentivize pools with points. In turn, point incentives cause another complication - as seen the FRAX-USDe pair has the lowest turnover value of 83%, while holding an impressive $68m of liquidity, encouraged by two protocols at once.
| Stable Pair | Average TVL (USD mn) | Volume (USD mn) | TVL Turnover Rate |
|---|---|---|---|
| USDe-USDT | 25.1 | 1,075.4 | 4282% |
| DAI-USDT | 138.3 | 692.9 | 501% |
| DAI-USDC | 200.1 | 453.0 | 226% |
| USD0-USDC | 45.6 | 434.3 | 952% |
| USDC-USDe | 24.7 | 326.5 | 1323% |
| GHO-USDC | 21.8 | 249.9 | 1146% |
| FRAX-USDC | 11.6 | 96.9 | 835% |
| FRAX-USDe | 68.1 | 56.3 | 83% |
3. Measurement and visualization of slippage
Despite the tremendous progress in stable swaps in recent years, fundamental inefficiencies remain, leading to an unfair and often random distribution of value among users. The exchange rate fluctuates with the ratio of tokens in the pool and eventually with the supply and demand ratio in a particular pair, resulting in a very possibility of price impact and opening a room for toxic MEV. The problem is exacerbated by the high fragmentation of liquidity between protocols and even pools within the same protocol, combined with the fact that 82.1% of total volume is generated by stable swaps with a volume greater than $100k, which results in a high price impact of an average trade. (Figure 5)
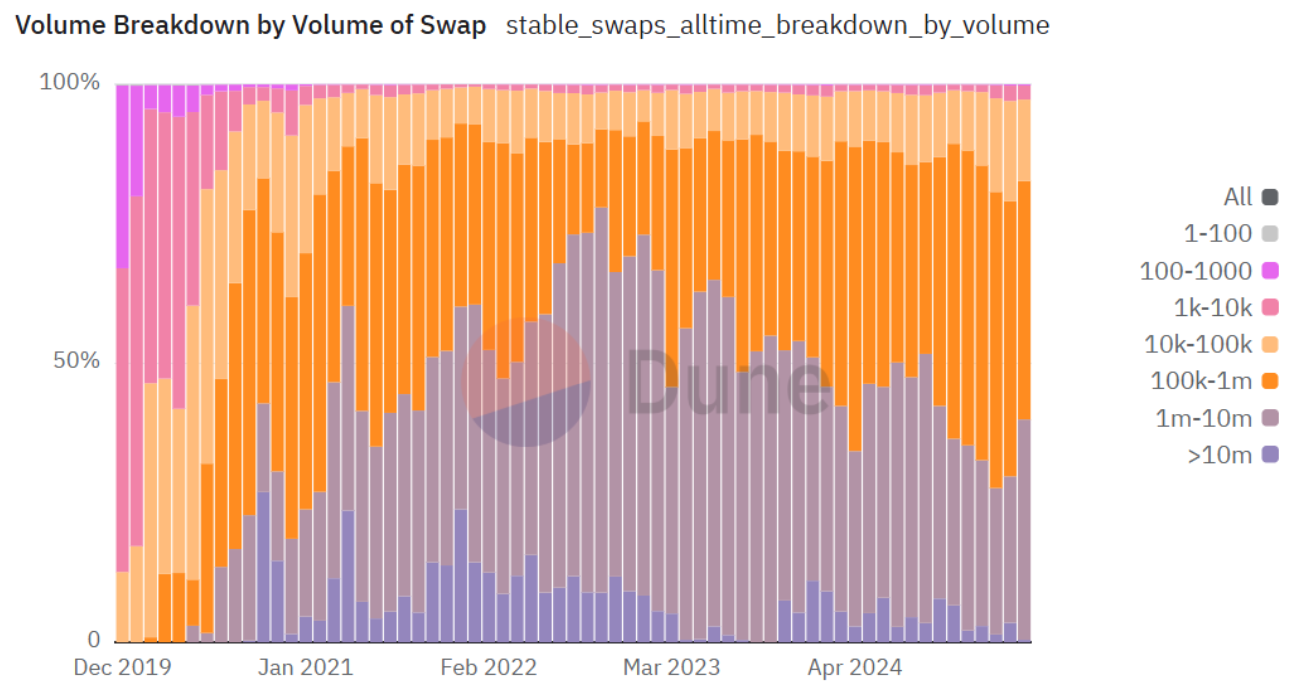 Figure 5. Share of the volume of stable swaps based on the volume of swaps.
All of this results in $8.1b of total retail2 volume on stable pairs encountering slippage3 greater than 0.1% over the past year. (Figure 6) It is noteworthy that moving from 0.1% to 0.2% slippage threshold, the volume exposed to slippage decreases by more than a half, while as the slippage threshold increases further, volumes decrease progressively less, indicating a relatively large volume encountered a high slippage - $0.93b was executed with slippage above 1%. Excluding the most liquid pair, responsible for more than 55.7% of the total volume - USDC-USDT - clearly shows that less liquid stable pairs are responsible for the majority of this volume, with USDC-USDT accounting for only 21.5% of the volume with slippage above 1%. (Figure 6)
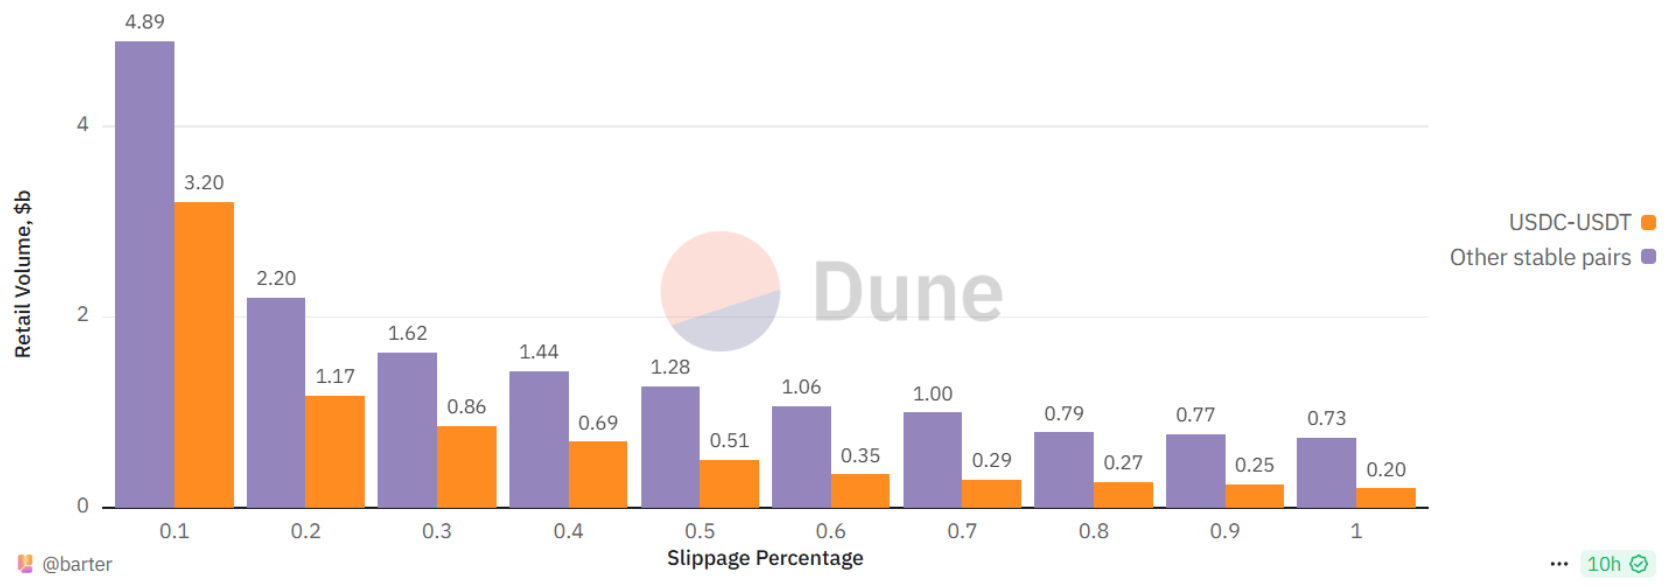 Figure 6. Retail stable swaps volume encountered slippage percentage equal or greater than a threshold over the past year (May 2024 - May 2025). For USDC-USDT pair (orange) and for all other stable pairs (purple).
The slippage distribution of retail swaps grouped by the volume of stable swaps demonstrates that trades between $1m and $10m are typically characterized by low slippage, indicating greater accuracy in selection of the appropriate pool. While 70.4% of retail volume with slippage above 0.8% are $10k to $1m swaps, which appear to have a higher slippage tolerance. (Figure 7)
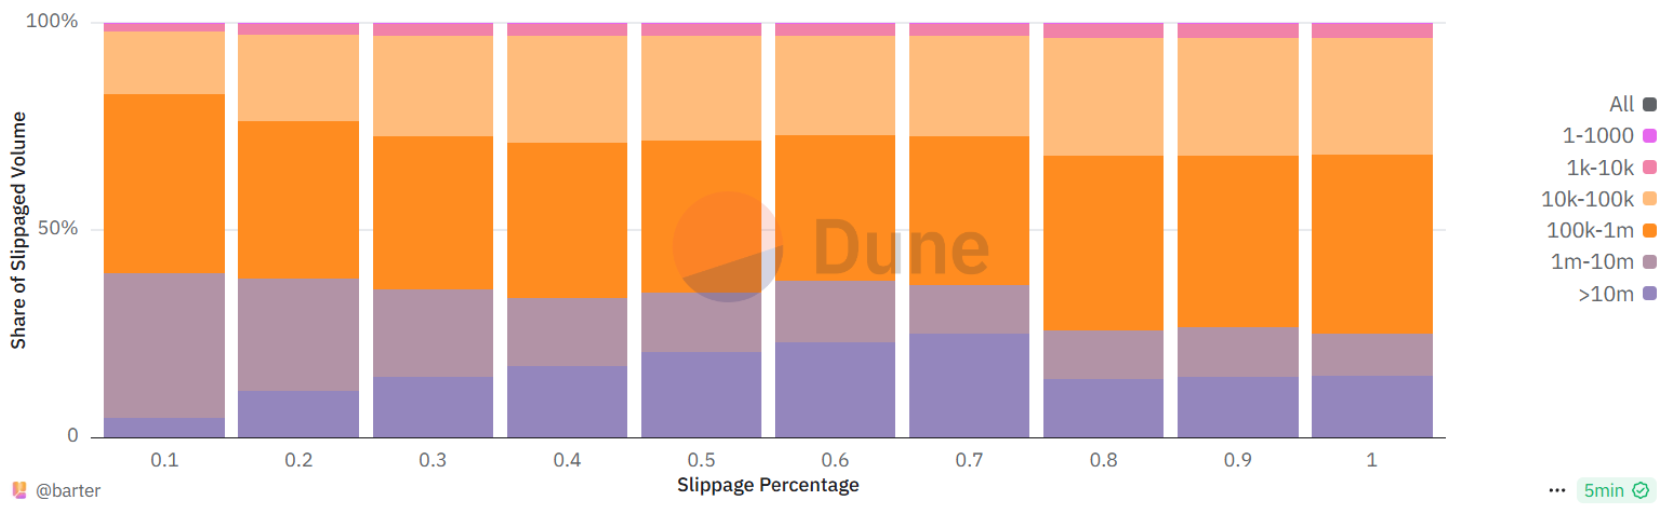 Figure 7. The share of retail stable swaps volume encountered a slippage percentage equal or greater than a threshold breakdown by a volume of swap over the past year (May 2024 - May 2025).
In order to illustrate and objectively measure slippage in stable swaps, we decided to plot the distribution of the number of retail swaps by the percentage of slippage encountered by them. The resulting distribution is a narrow general normal distribution symmetric around 0. One of our goals was to separate retail and toxic4 swaps to examine the affect of the latter on the former. As can be seen from the table below5, toxic trades are noticeably more likely to encounter positive slippage, while retail traders are more likely to have negative slippage. (Table 2) This is quantitatively described by the position of the 5% and 95% percentiles, in the case of toxic swaps the 95% percentile is often greater in absolute value than the 5% percentile, implying that the distribution is shifted towards positive values. In the case of retail swaps, the situation is usually the opposite. Moreover, the skewness6 parameter for retail swaps is almost always considerably negative7, while toxic swaps often have extremely high positive values of skewness. It is noteworthy that even on the ultra-liquid USDC-USDT pair, both retail and toxic swaps have skewness values which indicate a significant skewness of the distribution to either side. However, despite the significant volumes encountered considerable slippage and high values of skewness, the distribution of slippage percentage for the majority of stable pairs has a very low standard deviation value between 0.04% and 0.11%. (Table 2)
| Stable Pair | Total Volume (USD mn) | Average Volume (USD) | Retail p5, p95 Interval | Retail Skewness | Toxic p5, p95 Interval | Toxic Skewness | Slippage (%) Standard Deviation |
|---|---|---|---|---|---|---|---|
| USDC-USDT | 93,179.2 | 69,449 | -0.07; 0.05 | -1.264 | -0.07; 0.08 | 1.996 | 0.044 |
| USDe-USDT | 13,306.1 | 91,106 | -0.08; 0.05 | -0.255 | -0.09; 0.11 | 1.021 | 0.04 |
| DAI-USDC | 8,608.6 | 78,475 | -0.04; 0.03 | 1.515 | -0.03; 0.24 | 6.087 | 0.041 |
| USDC-USDe | 8,040.6 | 84,937 | -0.12; 0.08 | -2.214 | -0.11; 0.20 | 4.468 | 0.073 |
| USD0-USDC | 5,446.4 | 94,413 | -0.10; 0.06 | -2.741 | -0.09; 0.42 | 3.699 | 0.064 |
| USD0-USDT | 315.5 | 9,349 | -0.22; 0.12 | -1.14 | -0.09; 0.46 | 5.513 | 0.108 |
| GHO-USDe | 278.5 | 52,248 | -0.23; 0.13 | -1.025 | -0.18; 0.23 | 0.826 | 0.107 |
4. Toxic MEV in stable swaps - the hidden trouble behind the perfect facade
The results above show that despite the very low value of the standard deviation of slippage, significant value from positive slippage is extracted by MEV actors, even on liquid stable pairs. Which in turn, given both the growing issuance of stablecoins and their number, as well as the growing volume of stable swaps, opens up a large opportunity for MEV bots.
Furthermore, high average volume, liquidity fragmentation and the very possibility of slippage, open a vast room for MEV bots. We found that the share of stable swaps of all swaps affected by sandwich attacks has dramatically increased over the past six months, from 29.7% in December 2024 to 53.8% in May 2025. Moreover, in March 2025, the share of stable swaps hit a peak of 67.8%. (Figure 8) That's a huge number especially considering that slippage and price impact have to be minimal in stable swaps, since the price of both assets are pegged to the same benchmark.
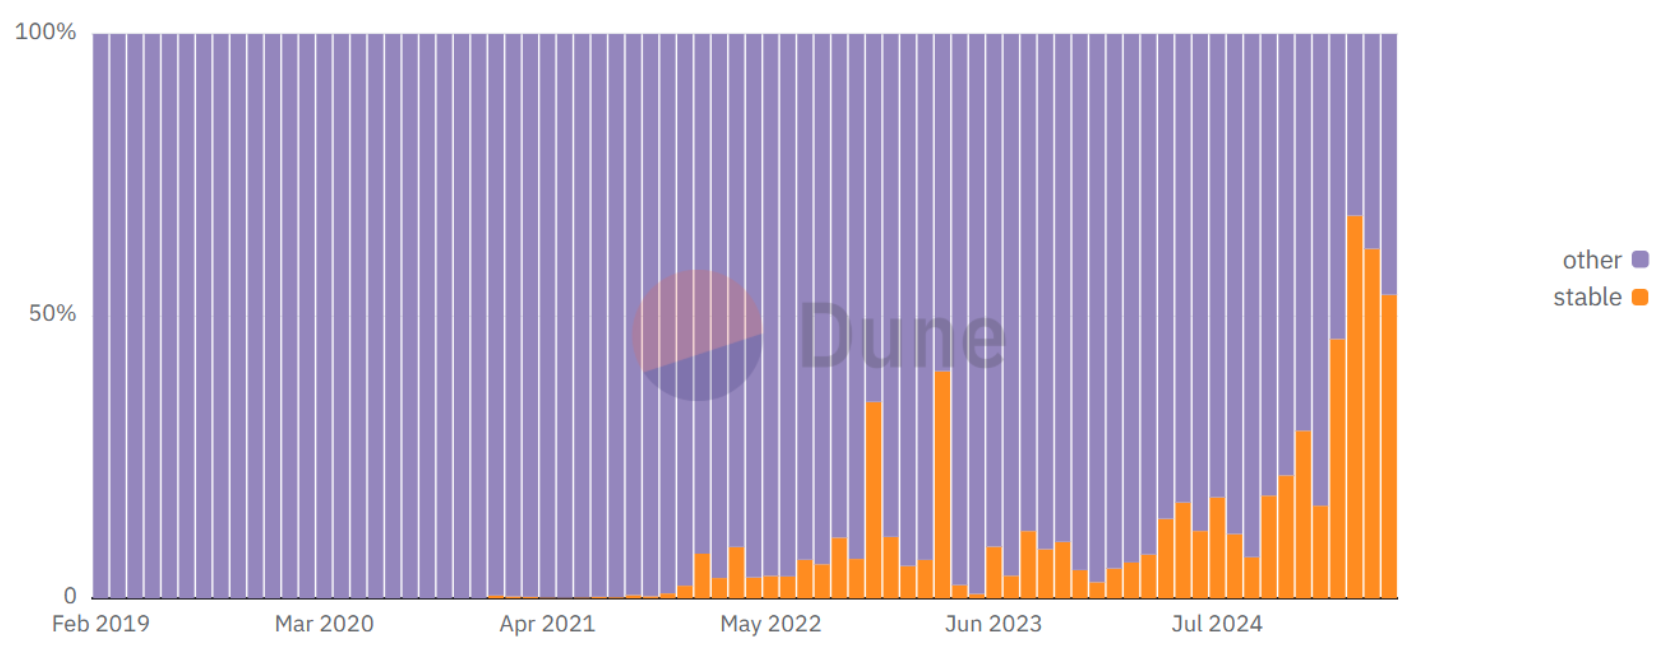 Figure 8. Share of stable swaps from volume of total sandwiched trades.
Drilling down into stable swaps specifically, the share of sandwiched swaps rose significantly over the last six months, reaching a peak of 6.0% in mid-March 2025, but by the end of May it had fallen to 1.9%. (Figure 9) Nevertheless, these are impressive numbers given the volume of stable swaps, with most of the sandwiched swaps being on the USDC-USDT pair. Thus, for April 2025, 5.7% of the total volume, or $578.5m in absolute terms, was sandwiched on USDC-USDT.
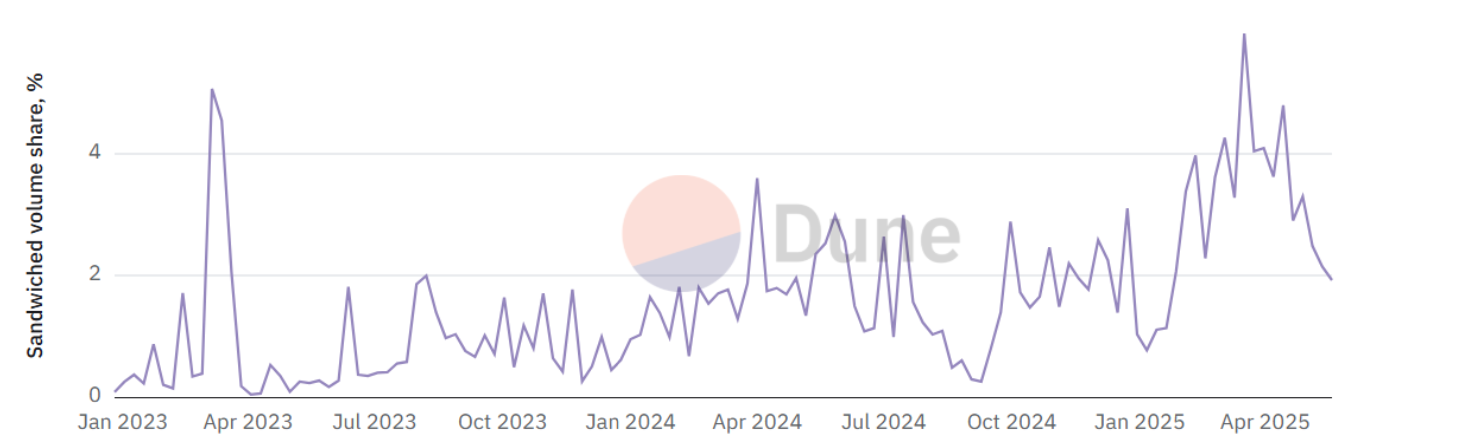 Figure 9. The share of sandwiched volume from total stable swaps volume.
However, the share of toxic swaps volume far surpasses the share of sandwiched swaps. Thus, the share of toxic MEV within stable pairs has been in the 20-50% range over the last two and a half years, excluding short-term releases. (Figure 10) However, in the last 5 months, the share of toxic flow has increased 2.8 times, from its low of 16.9% in early December 2024 to 47.0% by the end of May 2025. By generating additional fees for LPs, in the long run this leads to a PvP environment and losses for regular users. The problem will only worsen as the number of stablecoins increases.
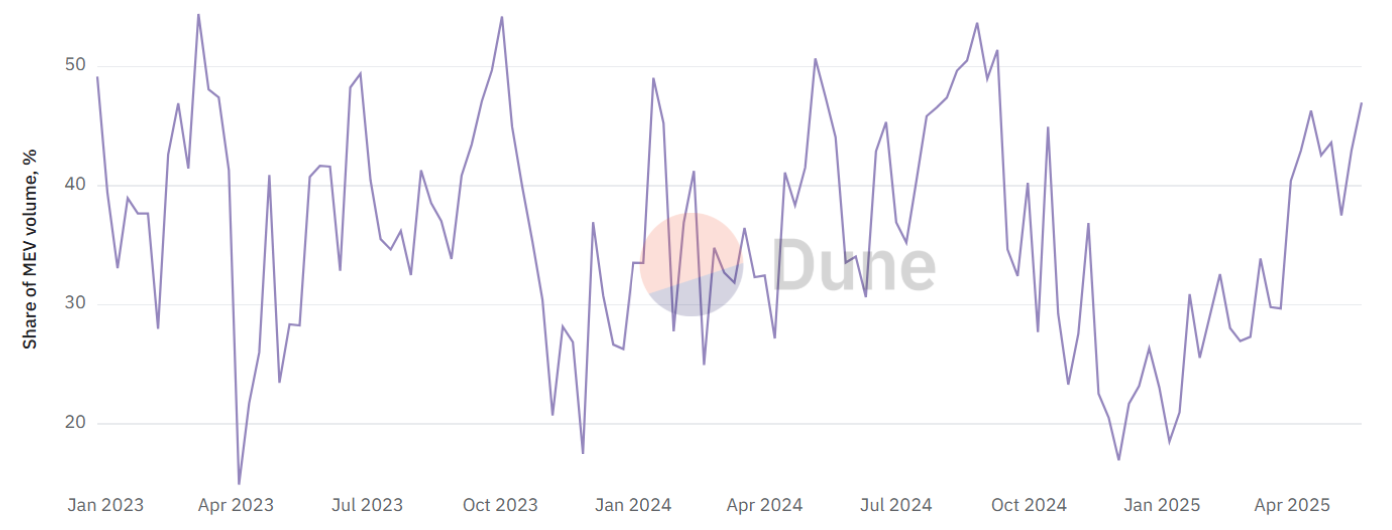 Figure 10. The share of volume of toxic swaps from total stable swaps volume.
It is remarkable that stable swaps have a high share of toxic trades, having both very low standard deviation of slippage and low volatility of stable pairs in general. In order to determine the reasons for this, we found that the share of fees earned by pools from toxic swaps is often significantly lower than toxic swaps share of total trades, indicating that these swaps are more likely to be made on pools with fees lower than the average for the pair. (Figure 11) Over the past 3 months, the share of fees generated by toxic trades is often about half their share of total trading volume.
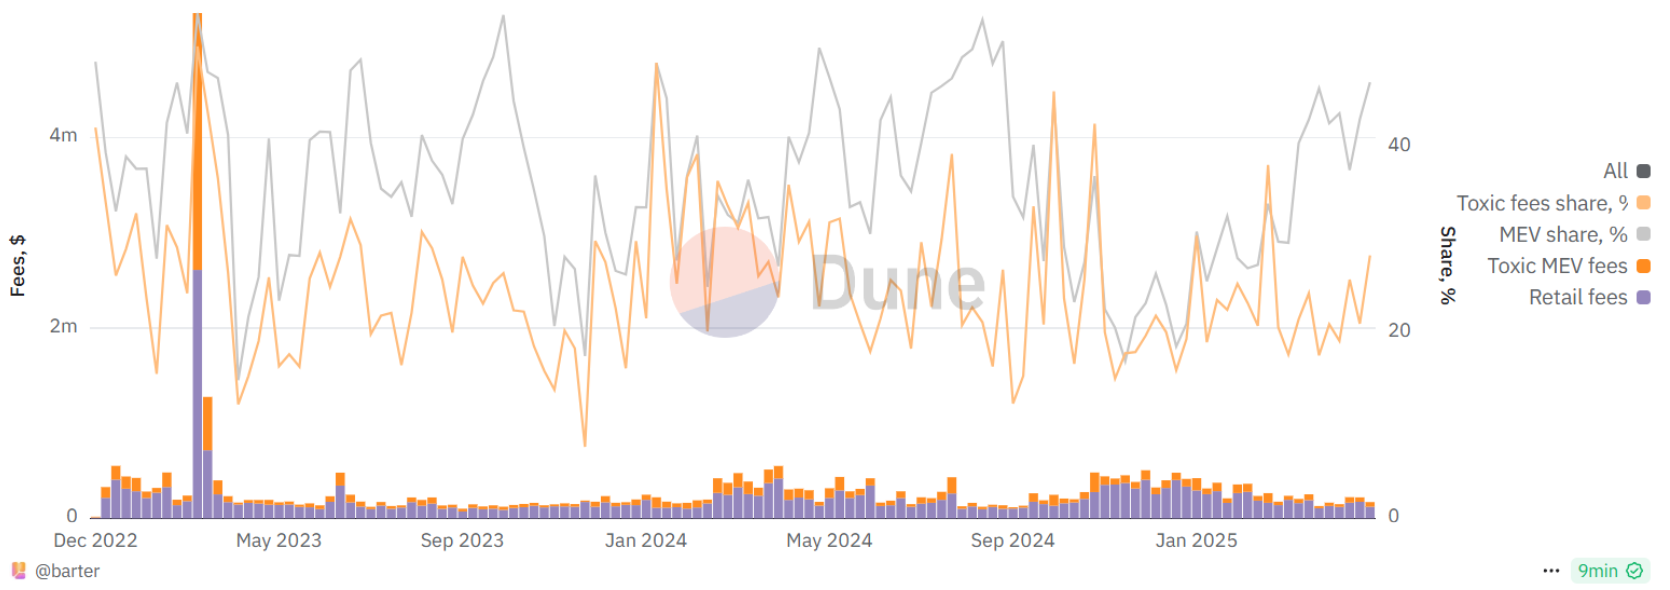 Figure 11. Fees generated by retail (bright orange) and toxic (purple) swaps, the share of toxic swaps fees from all fees (pale orange) and the share of toxic swaps volume from total stable swaps volume (gray).
In order to validate the hypothesis concerning a high proportion of toxic trades related to low protocol fees, the correlation of the average protocol fee with the share of toxic swaps since 2023 was examined. Both simple average fee and weighted average fee were tried, the weighted fee showed a higher correlation as it better describes the actual fees. Pearson and Spearman correlation coefficients showed values8 of -0.449 and -0.456 respectively, indicating a noticeable correlation between the share of toxic trades and the weighted fee. (Figure 12) Therefore, reduction of protocol fees on stable pairs favors the increase in the share of toxic flow.
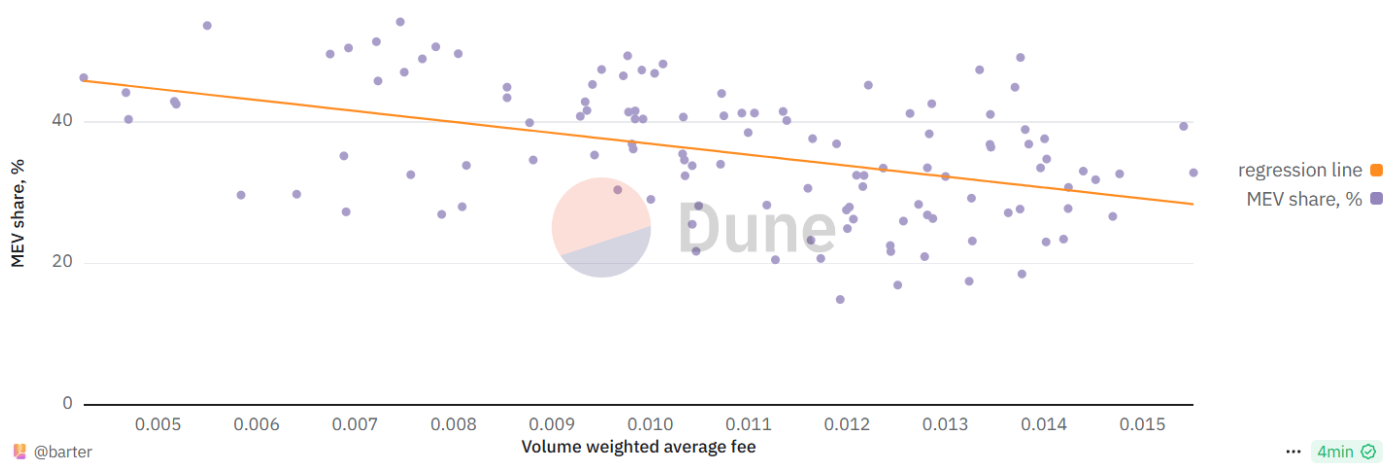 Figure 12. The weekly share of toxic flow volume from volume weighted average fee (bright orange) and corresponding linear regression line (purple).
However, with competition among DEXs for order flow, especially with the growing share of DEX aggregators, where the main criteria for obtaining order flow is providing the best exchange rate, average protocol fees have been decreasing dramatically over the past two and a half years. (Figure 13) The simple average fee has plunged from its peak values of 0.04 - 0.06% in the first half of 2023 to 0.011 - 0.016% over the past three months, while the volume-weighted fee has declined from 0.01 - 0.015% to ultra-low values of 0.004 - 0.008%. Notably, the average and volume-weighted average fees have converged significantly, indicating that more protocols are being forced to lower fees despite lower pools' APYs, and that more swaps are being executed in pools with low fees.
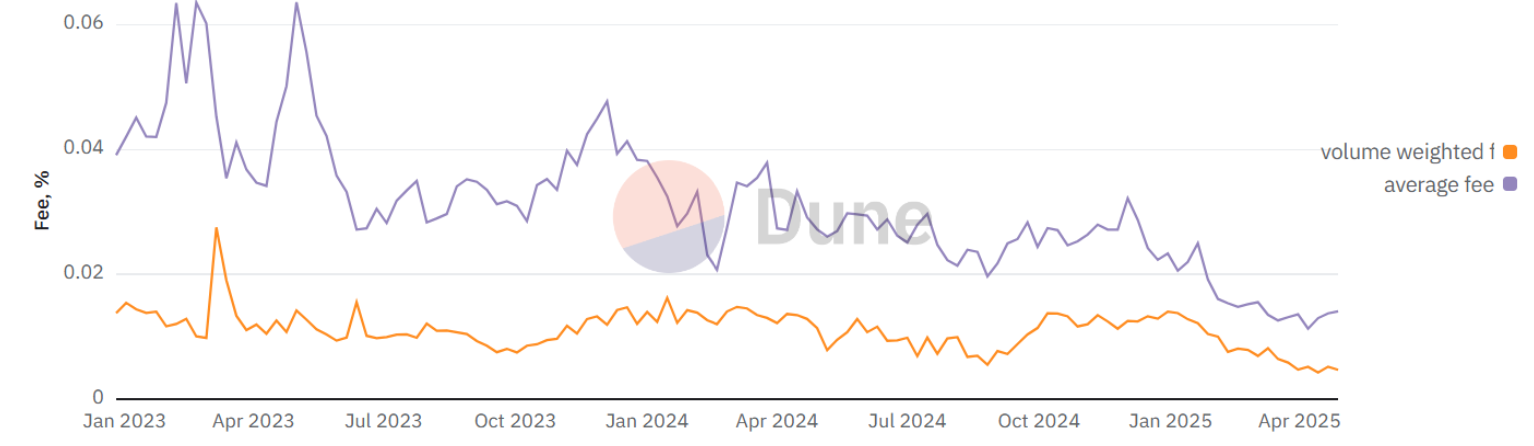 Figure 13. The weekly simple average fee percentage and volume weighted average fee percentage across all stable pairs.
Although fee dumping enables protocols to rapidly capture order flow, it also comes with its own side effects. Thus, Uniswap V4, launched in late January 2025, has already become the second- largest protocol by stable swaps volume after Maverick V2, it's noteworthy that both protocols leverage stable pools with ultra-low fees of 0.001%. However, extremely low fees tend to attract toxic flow: as of April 2025, a striking 61.3% and 80.2% of swap volume on Maverick V2 and Uniswap V4, respectively, consisted of toxic swaps. (Table 3) Nevertheless, an alternative approach exists allowing to deliver the best prices, while maintaining control over fees. In contrast, Fluid utilizing dynamic fees on the USDC-USDT pair has one of the lowest share of MEV swaps at just 4.7%, while maintaining its position as the third-largest protocol by stable swap volume with $2.28b over the same period. These observations highlight the effectiveness of dynamic fees in capturing order flow and simultaneously improving execution quality and shielding against toxic MEV.
| Protocol | Total Volume (USD mn) | Volume Weighted Fee (%) | MEV Share (%) |
|---|---|---|---|
| Maverick V2 | 4,532.3 | 0.0012 | 61.3 |
| Uniswap V4 | 4,016.0 | 0.0012 | 80.2 |
| Fluid | 2,486.2 | 0.0033 | 4.7 |
| Uniswap V3 | 2,271.9 | 0.0114 | 13.4 |
| Curve Regular | 1,081.7 | 0.0195 | 16.9 |
| Curve Stableswap NG | 1,080.1 | 0.0067 | 25.2 |
| Balancer V3 | 488.2 | 0.0067 | 19.0 |
| Dodo V2 | 278.2 | 0.0010 | 16.1 |
| Pancakeswap V3 | 77.3 | 0.0103 | 33.6 |
| Solidly V3 | 35.2 | 0.0050 | 74.8 |
| Dodo V1 | 22.0 | 0.0010 | 66.7 |
5. Superposition: evolving beyond AMMs in stable swaps
The data above demonstrates that there are still significant inefficiencies in stable swaps at the moment, especially for less popular and less liquid pairs. Efficient protocols with very low standard deviation of slippage represent one of two groups. Either ultra-concentrated pools with additional complications on top, such as moving liquidity concentration ranges like Maverick or time dependence like Fluid. Alternatively, protocols that utilize CPAMM curve approximation to CSAMM, like Curve. In both cases an increasing approximation to CSAMM in terms of exchange rate stativity and sustainability can be seen, achieved either by concentrating liquidity in a very narrow range of 0.01% - 0.1% or by applying huge amplification coefficient A = 8000, almost completely turning AMM into CSAMM.
Stable swaps in Superposition represent an absolutized extension of this tendency - Superposition utilizes a strict exchange rate with zero slippage in PMM manner. We assume that all risks associated with the greater reliability of one stablecoin relative to another, as well as the supply and demand ratio for a particular stablecoin, can be embedded in dynamic asymmetric fees managed by sophisticated entities. The rate independent of token ratio and the absence of slippage completely close any room for toxic MEV, as there are no price advantages to executing a transaction before any other.
Another crucial problem of the whole DeFi is the difficulty of migrating liquidity to new versions of the protocol or even to new pools within the same protocol. While multi-token pools allow the same tokens to be efficiently utilized in multiple pairs, adding a new token to the current pool remains impossible. In the context of stable swaps, this means that new stablecoins cannot access existing liquidity, magnifying slippage and the impact of MEV on new pairs. Superposition completely solves this problem, allowing new stablecoins to instantly access the liquidity of other pairs, as there is no need to create pools and lock up funds within them.
To prove the resilience of the simple CSAMM model or a strict 1-to-1 rate, we performed a backtest based on all stable swaps executed on DEXs for Oct 2024 - Mar 2025. The model executed stable swaps in all pairs between the 4 most liquid stablecoins - USDT, USDC, USDe and DAI, the initial TVL was equally distributed among the four stablecoins. Volume and swap share represents the share of executed volume/swaps from the total volume/swaps in the selected pairs. (Figure 14)
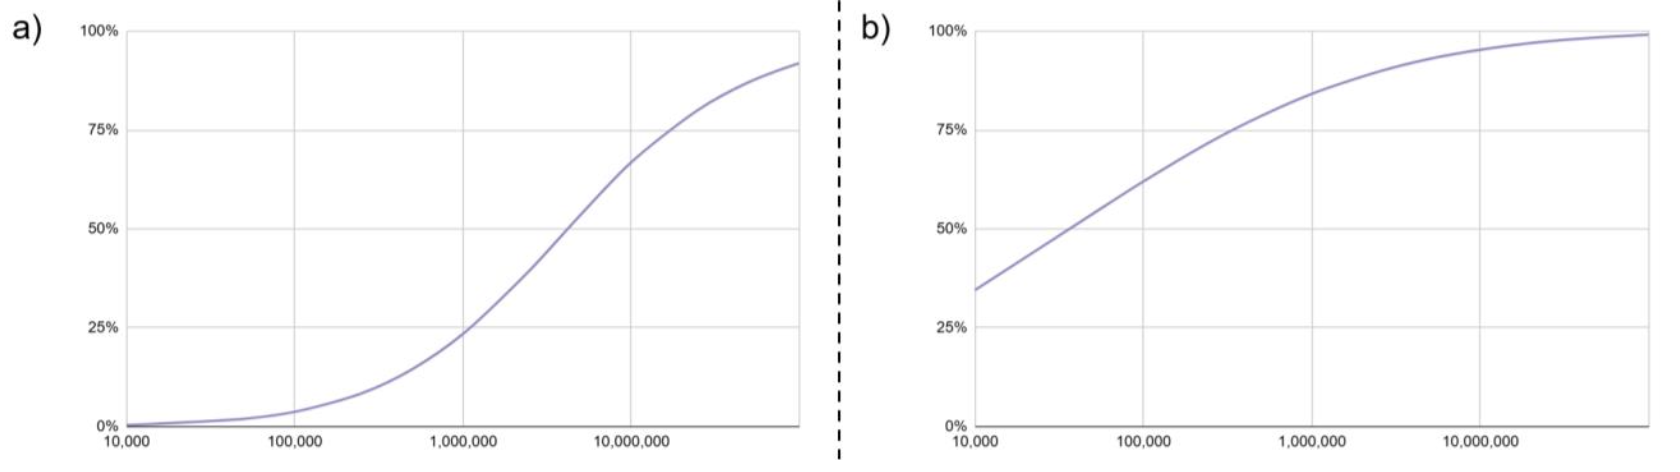 Figure 14. a) Share of volume executed by CSAMM model from total swaps in 6 selected pairs by logarithmic TVL. b) Share of swaps executed by CSAMM model from total swaps in 6 selected pairs by logarithmic TVL.
The obtained data clearly demonstrate that the CSAMM pricing logic is resilient and applicable, the pool is successfully rebalanced due to changes in supply and demand. Even with a modest TVL of $5m distributed among 4 stablecoins, the pool is able to handle 53.6% and 93.0% of the total volume and swaps in pairs respectively, while completely eliminating slippage and price impact.
Nevertheless, the market price in a particular stable pair is almost always unequal to 1. Taking into account the growing share of DEX-aggregators, stable swaps at 1-to-1 rate are inefficient for the liquidity provision. Since a rational participant will choose the best exchange rate, when the market price deviates from 1, CSAMM starts executing swaps in only one particular direction. For example, let's examine the FRAX/USDC pair and take the market (fair) price equal to 0.998, in this case the rate to buy FRAX (USDC->FRAX) will be 1/0.998 ≈ 1.002, while CSAMM will offer a rate 1 in both directions, which will lead to the liquidity being utilized to execute swaps only in one, more favorable, direction (USDC->FRAX in the example). In the case where the market rate is often enough to be either less or greater than 1 (Figure 15, a)), this will only lead to a decrease in volumes through the pool. However, if the exchange rate is greater or less than 1 for a prolonged period of time (Figure 15, b)), it will cause all liquidity to flow into one of the tokens (FRAX in the example above) and shut down the pool.
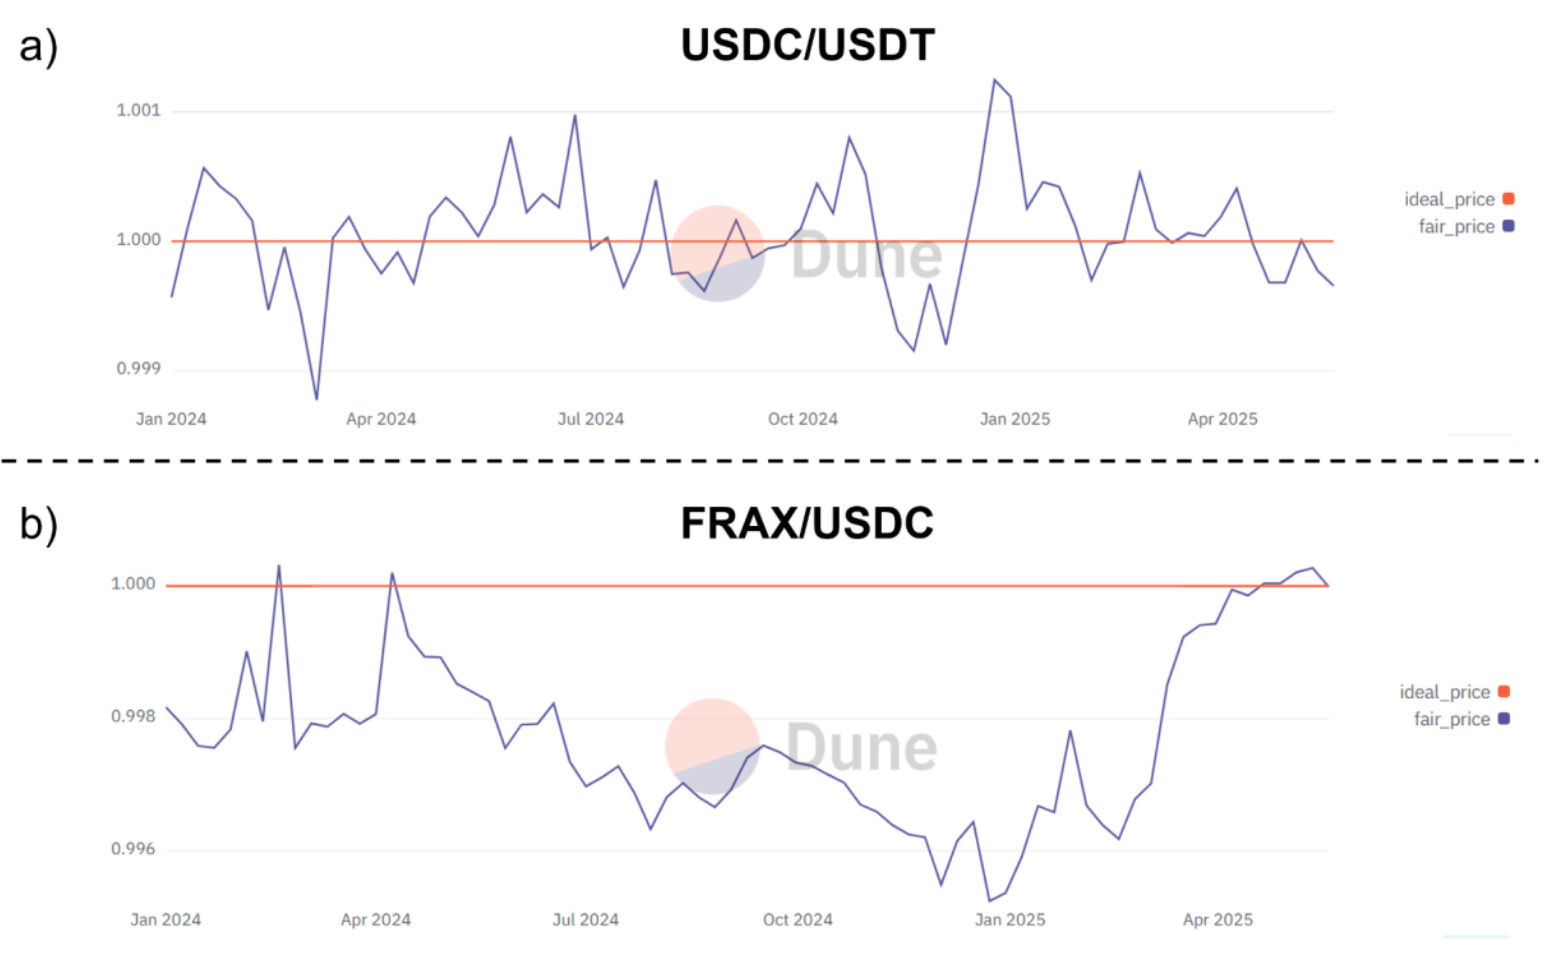 Figure 15. a) Fair weekly price for USDC/USDT pair. b) Fair weekly price for FRAX/USDC pair.
In light of this, a model utilizing market price is needed to make such stable swaps viable in a competitive environment with other protocols. Superposition allows LPs to utilize any pricing logic, such as PMM prices. We performed a backtest in which Superposition executed swaps at the daily fair price with zero slippage. The backtest was conducted using the same dataset of stable swaps between USDT, USDC, USDe and DAI as before. To compare Superposition with existing models, the backtest involves Curve pool and Uniswap V3 pool10 with the same starting TVL, in each particular swap the best rate was chosen among the actual rate observed, Curve model rate, Uniswap V3 model rate and Superposition rate.
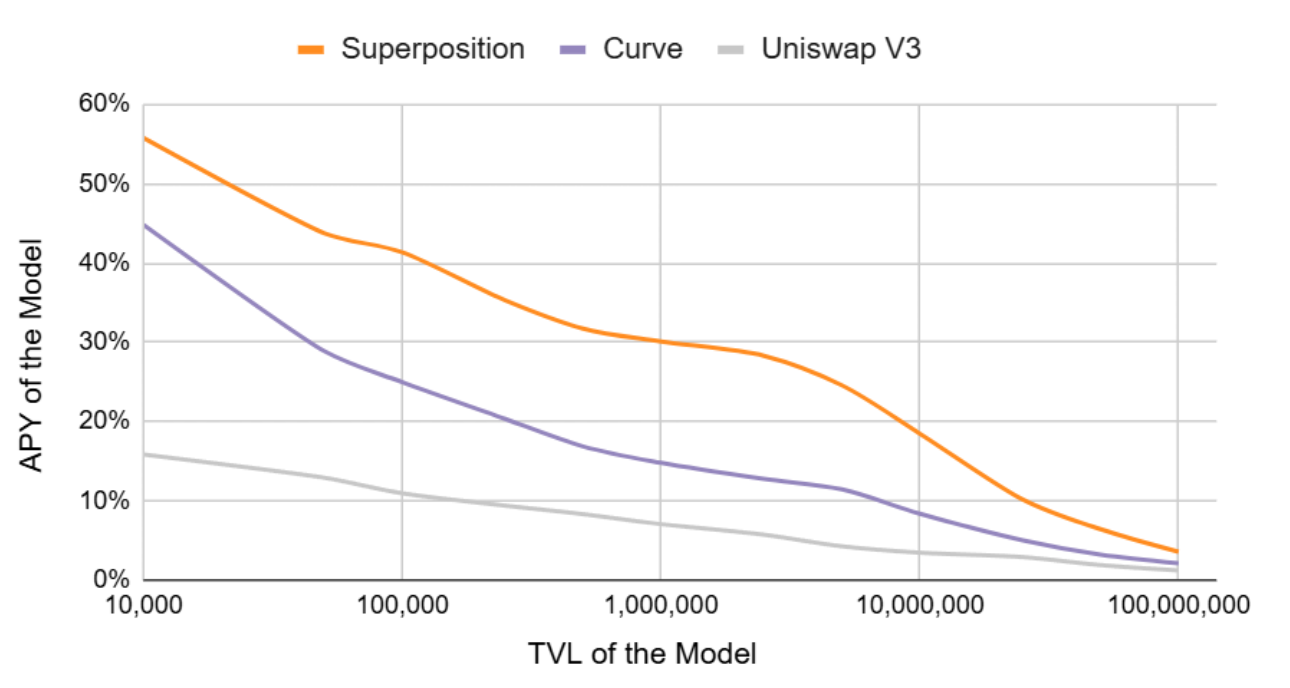 Figure 16. APY of a model executing swaps in 6 selected pairs by logarithmic TVL.
Superposition, executing swaps at a fair market price with zero slippage, even without dynamic and directional fees, significantly outperforms Curve and Uniswap models in terms of APY. (Figure 16) At TVL of $5m, Superposition generates 24.6% APY on the four most trusted stablecoins, which is more than twice the value accrued by the Curve pool with similar starting parameters. Moreover, the obtained data clearly show the importance of multi-token pools, as the Uniswap V3 model with liquidity distributed among 6 pairs significantly loses in capital efficiency to the Curve and Superposition models that utilize all liquidity in all pairs at once.
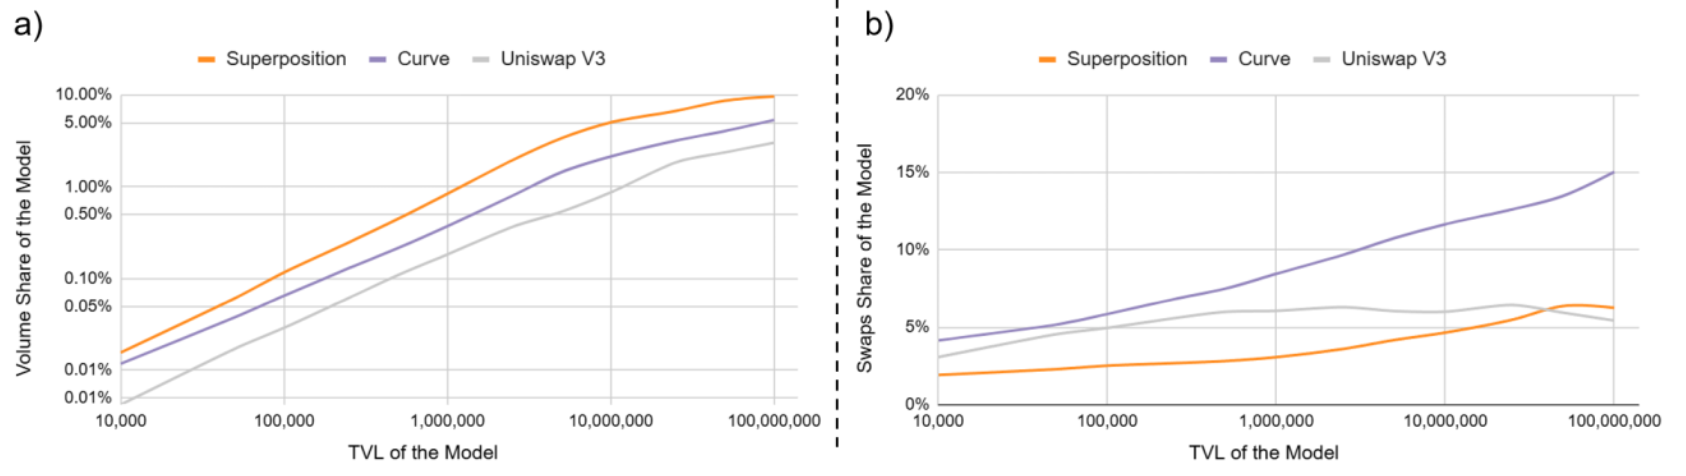 Figure 17. a) Share of volume executed by a model from total volume in 6 selected pairs by logarithmic TVL. b) Share of swaps executed by a model from total swaps in 6 selected pairs by logarithmic TVL.
Notably, despite having the highest APY and volume share, the Superposition model lags behind Curve and even Uniswap V3 models in the share of swaps. (Figure 17) With TVL equal to $5m and fees optimized for the highest APY, the Superposition model holds 3.4% volume and 4.2% of all trades, while Curve and Uniswap V3 have 1.5%, 10.8% and 0.5%, 6.0% respectively. Which corresponds to the average swap volume through Superposition, Curve, Uniswap V3 equal to $59.2k, $9.8k and $6.5k respectively. Since in the backtest the best possible rate was chosen for each swap, the rate of Curve and Uniswap V3 models had to follow the market rate, which means that such an impressive difference in the average swap volume is caused by the absence of slippage in the Superposition model, which especially affects the exchange rate for large swaps.
6. Conclusion
Stable swaps account for over 30% of total DEX trading volume, making them a foundational yet underexamined component of DeFi infrastructure. Despite the expected simplicity and reliability of swaps between two stablecoins, substantial inefficiencies persist. Over the past year, $8.1 billion in retail stable swap volume encountered slippage greater than 0.1%, with $930 million exceeding 1%. These inefficiencies are further exacerbated by the strong presence of toxic MEV activity which now constitutes 47.0% of total stable swaps volume.
A key driver of the problem is fee compression. Over the last two and a half years, average fees on stable pairs have declined more than fivefold, with volume-weighted fees reaching as low as 0.005%. While commission dumping allows protocols to significantly increase their executed trading volume, up to 80% of this volume turns out to be MEV, which is given free rein by reduced fees. In contrast, dynamic fee models have shown promise in reducing MEV exposure while maintaining execution efficiency.
To explore potential improvements, we conducted a backtest of a PMM-like model based on volume-weighted average prices (VWAP), designed to enable slippage-free execution. Implemented within the Superposition protocol, this model demonstrated particularly strong performance on large-volume stablecoin swaps, offering superior capital efficiency and higher returns for liquidity providers. Compared against dominant AMM implementations, the approach showed meaningful gains in both execution quality and resilience to MEV. Obtained results suggest that zero-slippage models represent a viable path toward more efficient and MEV-resistant stable swap infrastructure.
7. Methodology
Stablecoins covered
This research covers all swaps between the following stablecoins unless otherwise stated: USDT, USDC, DAI, USDS, USDe, FRAX, GHO, RSV, USD0, USDD, TUSD, sUSD, MIM, USDP and others.
Derivative stablecoins, such as LP tokens of stable pools or tokenized positions on lending protocols, as well as yield bearing stablecoins are not included in the study.
Data sources
All data provided in the survey were obtained using Dune unless otherwise stated. The updatable data and its visualization covered in the research can be found here. Following Dune’s datasets were used:
- dex.trades
- dex_aggregator.trades
- labels.stablecoins
- dex.pools
- dex.sandwiches
- dex.sandwiched
- dex.atomic_arbitrages
- addresses_ethereum.mev
- uniswap_v4_multichain.poolmanager_evt_swap
- balancer.liquidity
A custom dataset covering fees in the largest stablecoin pools not included in dex.pools was also collected and used:
- dune.barter.dataset_stable_pools
TVL calculation
Stable pools for TVL calculation were identified by project_contract_adress in dex.trades. However, for protocols that employ an architecture with a liquidity layer - a contract holding all the liquidity of the protocol - this approach produces the incorrect results. Therefore:
- Balancer liquidity can be added using balancer.liquidity dataset
- Uniswap V4 stable pools' TVL is overestimated, as all deposits of stablecoins in this case are taken into account
- Fluid stable pools' TVL is not taken into account
Slippage estimation, its valuation and distribution
Slippage was calculated using formula (1) relative to the weekly “fair” price based on the assumption of pool fees are deducted from incoming tokens (𝑡𝑜𝑘𝑒𝑛𝑆𝑜𝑙𝑑𝐴𝑚𝑜𝑢𝑛𝑡):
Either the volume-weighted average price (2) or the volume-weighted geometric average price (3) was taken as the weekly “fair” price in each period, the price with the smallest deviation from the “ideal” price taken as 1 was selected:
Where the 𝑜𝑏𝑠𝑒𝑟𝑣𝑒𝑑𝑃𝑟𝑖𝑐𝑒𝑖 is defined as:
The 𝑓𝑎𝑖𝑟𝑃𝑟𝑖𝑐𝑒 is calculated by the equation below (5):
Logarithmic weighted prices were calculated to ensure that the resulting “fair” price is a reciprocal-invariant function and does not depend on the selection of the base and quote token. Since the fair price is almost always located in the range of 0.995 - 1.005 the usage of logarithmic weighted prices results in a negligible error. 𝑏𝑎𝑠𝑒𝑇𝑜𝑘𝑒𝑛𝑃𝑟𝑖𝑐𝑒 and 𝑞𝑢𝑜𝑡𝑒𝑇𝑜𝑘𝑒𝑛𝑃𝑟𝑖𝑐𝑒 were taken from prices.hour. For USDT, USDC, DAI and USDe spot prices are provided by CoinPaprika, for the rest of the stablecoins Dune calculates prices as VWAP relative to the above trusted stablecoins using dex.trades.
The weekly price was selected to minimize the impact of slippage in long-tail stable pairs on the “fair” price. If a daily price is used, the obtained results change slightly.
In order to estimate the slippage encountered by retail traders (including aggregators), we excluded using the above datasets and considered as “toxic”: atomic arbitrage trades, sandwich attack trades, as well as all trades involving MEV bots. The following assumptions were made:
- For pools with dynamic fees, the minimum fees allowed for the pool have been taken
- Since skewness and standard deviation are sensitive to outliers, they were calculated for values between the 1% percentile and 99% percentile
CSAMM backtest
The objective of the backtest was to verify the liveness of a simple CSAMM model on a real supply/demand ratio for selected stablecoins.
Backtest was performed for all stable swaps across USDT, USDC, USDe, DAI on DEXs from October 2024 to March 2025. The starting TVL of CSAMM pool model was equally distributed among the selected stablecoins, then the pool “executed” all swaps in chronological order, if the CSAMM model did not have enough liquidity to execute a swap, it was skipped.
Superposition backtest
Since the simple CSAMM, despite its robustness, proves to be low performing in the competitive space with existing models, a backtest of a simple PMM-like model was conducted. The rate for stable swaps in Superposition was taken to be equal to the “fair” price used to calculate slippage (4), and swaps through the model were executed with zero slippage at all times. Backtest was performed using similar DEX stable swaps dataset as in the CSAMM one.
Backtests were performed using hourly, daily and weekly “fair” prices. The model using daily prices as the exchange rate showed the best performance and resilience. Thus, all data in the study is given for the daily “fair” price.
To simulate competitive conditions, assuming economically rational behavior of the participants, the model offers a best exchange rate between the three models used in the backtest and the rate at which the swap was actually executed on-chain was chosen for execution of each swap. To execute the swap the models also had to have enough liquidity and meet the set requirement of negative slippage tolerance less than 0.1%.
In order to compare the PMM-like Superposition model with the widely used stable swap models from Curve and Uniswap V3, the corresponding models also competed for swap fulfillment. Invariants (6) and (7) were used to simulate the Curve and Uniswap V3 models, respectively:
All models had the same starting parameters, which included:
- Fee for USDC-USDT swap – 0.025%
- Fee for other stable pairs – 0.03%
- Starting TVL equally distributed between USDT, USDC, DAI and USDe
Since Uniswap does not have multi-token pools the starting TVL in this case was distributed equally among the following pools: USDC-USDT, DAI-USDC, DAI-USDT, DAI-USDe, USDC-USDe, USDe- USDT.
Specific starting parameters used for Curve and Uniswap V3 models:
- 𝐴 = 8000 for Curve model
- 𝑃 = 0.999, 𝑃 = 1.001 for Uniswap V3 model
The fees collected by the models were held separately from the liquidity of the models, thus the fees accrued could not participate in the execution of the swaps.
8. Disclaimer
This paper is for general information purposes only. It does not constitute investment advice or a recommendation or solicitation to buy or sell any investment and should not be used in the evaluation of the merits of making any investment decision. It should not be relied upon for accounting, legal or tax advice or investment recommendations. This paper reflects current opinions of the authors and is not made on behalf of Barter or its affiliates and does not necessarily reflect the opinions of Barter, its affiliates or individuals associated with them. The opinions reflected herein are subject to change without being updated.
